I use Grafana to log and visualize data from all my devices such as inverters, charge controllers, etc. In this article, we will set up Grafana, together with Prometheus and Node Exporter to form the base of a data visualization system for a wide variety of devices. We will do this on a Debian Virtual Machine, but the process is pretty much the same on Ubuntu and other derivatives or a physical machine. The set-up on Raspberry Pi, while also running a Debian derivative, is slightly different and will be detailed in another post.
Debian
Getting to play with Debian is easiest to do inside a virtual machine, such as VirtualBox. The good thing is that there are readily available images with Debian for download. At this time, Debian 11 is the latest version, so this guide will assume we use that one. You don’t need the desktop image; the server image (which does not include the graphical user interface and other stuff) will do fine. However, if you feel more comfortable with a full GUI at your disposal, feel free to use it.
Once you have downloaded your preferred image, extract it. You should have a file ending with .vdi. We have to open it with VirtualBox: create a new virtual machine:
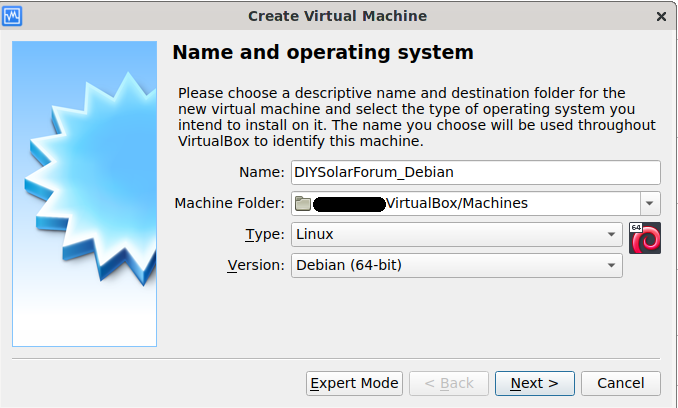
After you click next, you will be asked to give the VM some memory: 4GB should be more than enough. In the next step, you will be asked for a hard disk. This is where the previously downloaded file comes in. Select “Use and existing virtual hard disk image”, add the downloaded one to the list, and select it. Then press create.

Before you start your VM, make sure you configure your network interfaces: the easiest is probably to pick a bridged network interface (Settings –> Network). This will give the virtual machine an IP address in the same manner any other physical device on your network gets one. This makes life easier.
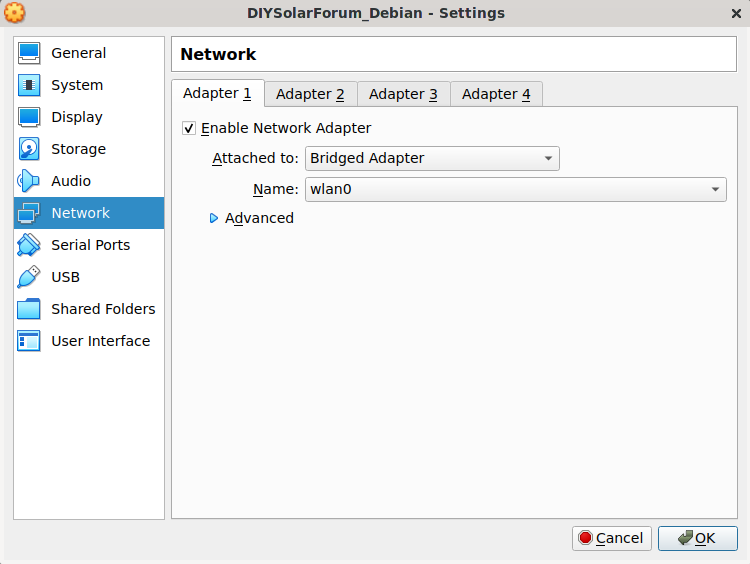
That’s it; you can now start the VM:
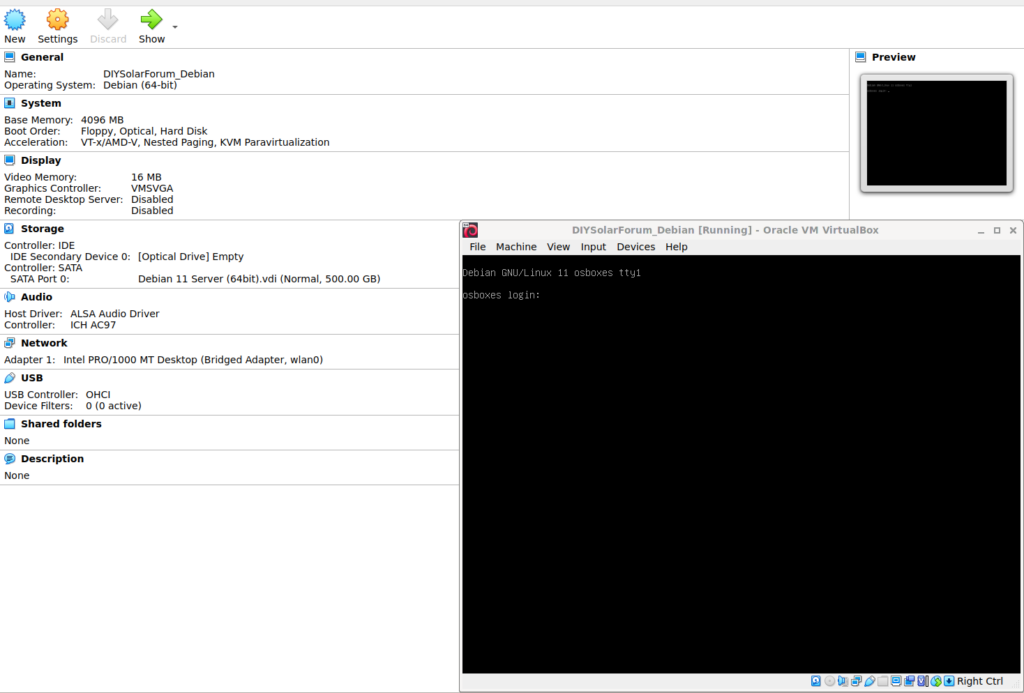
You can log in with user: root with password: osboxes.org for the root user, and user: osboxes with password osboxes.org. Let’s log in as osboxes, in part because we’ll connect over SSH in a little while and root is not allowed to do so by default. It’s also a good idea in general.
Installation
The first step is to bring the distribution up to date. Run these commands in sequence:
sudo apt updatesudo apt -y upgrade
You will be prompted for a password – it’s the same as the one you used to log in. This operation might take some time. After that, you have a fully up to date system.
Ok – little break: typing over commands is painful, and it would be better to just paste these commands. You can’t do that directly, so we have to connect to our virtual machine using a program like Putty. This enables you to use the SSH protocol to log in to the virtual machine, and copy/paste from the terminal. You also need the ip address of the virtual machine. You get that by using the following command:
ip a
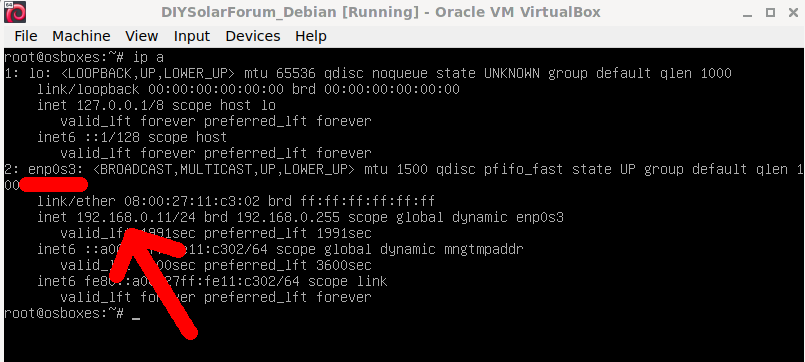
Now you can connect with Putty, and use the same username/password as before:
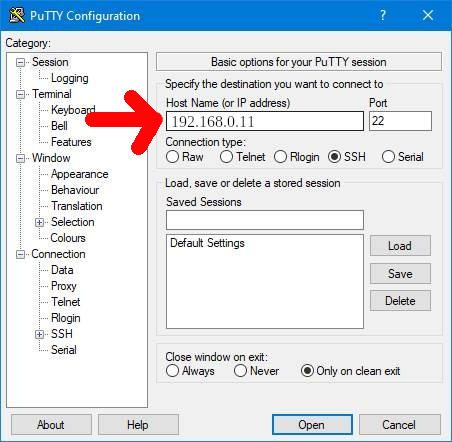
Once you are connected, any text that you copy on the Windows side, can be pasted in Putty by clicking the right mouse button.
In order to install Grafana and related, you need to first add the Grafana repository so apt can find it. To do that, run the following:
sudo apt install -y apt-transport-https gnupgsudo apt install -y software-properties-common wget
The following is one line:sudo mkdir -p /etc/apt/keyrings/sudo wget -q -O - https://apt.grafana.com/gpg.key | sudo gpg --dearmor > /etc/apt/keyrings/grafana.gpg
The following is one line:sudo echo "deb [signed-by=/etc/apt/keyrings/grafana.gpg] https://apt.grafana.com stable main" | sudo tee /etc/apt/sources.list.d/grafana.list
Followed by:
sudo apt update
Now we can install the required packages:
sudo apt -y install grafana prometheus prometheus-node-exporter
Almost there. Just run the following two commands to make sure it all starts up, and automatically does so at reboot:
sudo /bin/systemctl enable grafana-serversudo /bin/systemctl start grafana-server
You should now be able to connect to Grafana with a browser on your Windows side of things, with the following url:
http://192.168.0.11:3000/
Where “192.168.0.11” matches the IP address of your virtual machine. You can log in with the username ‘admin’ and password ‘admin’. You’ll be prompted to change your default password, but you can also skip that for the time being.
You can also verify that node-exporter is running by visiting this url:
http://192.168.0.11:9100/metrics
Again, make sure you replace the IP address in the snippet above with yours.
Raspberry Pi
In case you’d want to have the above system running on a Raspberry Pi, do the following.
To get Grafana going on the Raspberry Pi, I will assume you already have a Pi up and running. If you want to start from scratch, have a look at the Raspberry Pi operating system download page. I start this guide by assuming you have at least a minimal, up to date, install (with or without desktop), connected to the network. Like mentioned in the Debian set-up guide, we can use Putty to remotely connect to the Pi and execute all commands by copying/pasting from this guide. For this, make sure SSH is enabled on the Pi, and use the usual pi/raspberry username and password combination to log on. This guide is not for the Pi Zero – it uses a different architecture and needs different binaries.

Installation
In order to install Grafana and related, you need to first add the Grafana repository so apt can find it. To do that, run the following:
sudo apt install -y apt-transport-https gnupgsudo apt install -y software-properties-common wgetwget -q -O - https://packages.grafana.com/gpg.key | gpg --dearmor | sudo tee /usr/share/keyrings/grafana-archive-keyring.gpgsudo cp /usr/share/keyrings/grafana-archive-keyring.gpg /etc/apt/trusted.gpg.d
This last command will print some ‘garbage’ to the console. Ignore it. Press enter once it’s done to have a clean command prompt. Then continue with:
echo "deb https://packages.grafana.com/oss/deb stable main" | sudo tee -a /etc/apt/sources.list.d/grafana.list
Followed by:
sudo apt update
Now we can install the required packages:
sudo apt -y install grafana prometheus prometheus-node-exporter
Almost there. Just run the following two commands to make sure it all starts up, and automatically does so at reboot:
sudo /bin/systemctl enable grafana-serversudo /bin/systemctl start grafana-server
You should now be able to connect to Grafana (give it a few seconds to start up) with a browser on your Windows side of things, with the following url:
http://192.168.0.11:3000/
Where “192.168.0.11” matches the IP address of your Raspberry Pi. You can log in with the username ‘admin’ and password ‘admin’. You’ll be prompted to change your default password, but you can also skip that for the time being.
You can also verify that node-exporter is running by visiting this url:
http://192.168.0.11:9100/metrics
Again, make sure you replace the IP address in the snippet above with yours.
Now that we have Debian or a derivative running on either a real machine, a VM or a Raspberry Pi, we can configure the system to actually do something. This section will provide the configuration basics to start talking to devices such as inverters, charge controllers and BMS. We go into the data format expected for Grafana, but won’t detail every single device – that will be available in a list with links to repositories of scripts to do this part.
Grafana Configuration
Let’s make sure everything is where it’s supposed to be. We will be using the ‘nano’ editor to edit files. You only need two shortcuts:
– ctrl+o enter to save the file
– ctrl+x to exit the file
Ramdisk
First of all, let’s start with creating a ramdisk where the data will be stored temporarily before they are pushed to the Prometheus database. This directory sees lots of writes, so by making it a ramdisk we’re not stressing the SSD (or SD Card). Edit the /etc/fstab file:
sudo nano /etc/fstab
And add this at the end of the file on its own line:
tmpfs /ramdisk tmpfs nodev,nosuid,size=5M 0 0
Save with ctrl-o enter, and then exit with ctrl-x. This will ultimately create a ramdisk, 5M in size, and will be mounted under /ramdisk. This directory does not exist yet, so let’s create it:
sudo mkdir /ramdisk
We can now right away mount this ramdisk:
sudo mount /ramdisk
Plugins
Grafana has a bunch of possible plug-ins. Let’s install some commonly used ones.
sudo grafana-cli plugins install grafana-clock-panelsudo grafana-cli plugins install briangann-gauge-panelsudo grafana-cli plugins install dalvany-image-panelsudo grafana-cli plugins install innius-video-panel
After installing these plug-ins, you can restart Grafana with:
sudo systemctl restart grafana-server
Retention time
By default, data retention time is set to 15 days. For our purposes we’d like to increase this to a year at least, maybe even more. To do this, we have to edit the /etc/default/prometheus file:
sudo nano /etc/default/prometheus
Make sure the line that states ARGS=”” looks like this:
ARGS=”–storage.tsdb.retention.time=1y”
Restart Prometheus with:
sudo systemctl restart prometheus
Node Exporter
We have to tell Node Exporter where to find the data it needs to put into Prometheus, namely /ramdisk. Edit the /etc/default/prometheus-node-exporter file:
sudo nano /etc/default/prometheus-node-exporter
Make sure the line that states ARGS=”” looks like this:
ARGS="--no-collector.mdadm --no-collector.pressure --no-collector.rapl --collector.textfile.directory=/ramdisk"
Here, pressure and rapl collector get disabled because they generate a bunch of error messages on systems that don’t have it enabled, like the Raspberry Pi. The textfile collector is the one we need to process our data.
Restart Node Exporter with:
sudo systemctl restart prometheus-node-exporter
We can check Prometheus at:
http://192.168.0.11:9090/
Let’s test if this all works. Create a file in /ramdisk called MUST_INV.prom. This is a sample data file for a MUST inverter, with a couple of datapoints:
sudo nano /ramdisk/MUST_INV.prom
Add these lines:
MUST_INV{mode="batVolts"} 52.0MUST_INV{mode="batAmps"} 50.0MUST_INV{mode="loadPercent"} 25MUST_INV{mode="outputW"} 800MUST_INV{mode="outputVA"} 1200MUST_INV{mode="tempInt"} 60
Save with ctrl+o enter again, and exit with ctrl+x. Now wait a few seconds (15 or so) and then go back to the Prometheus URL:
http://192.168.0.11:9090/
When you enter ‘MUST_INV’ in the query entry field and press execute, you should see something like this:
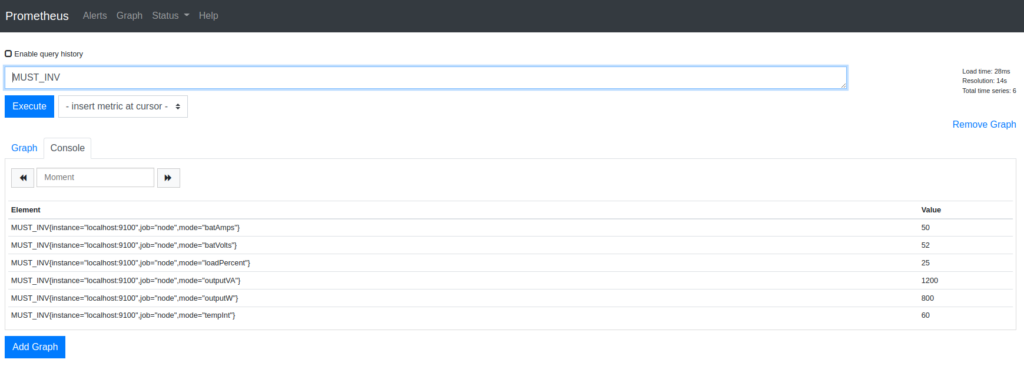
This means Node Exporter is successfully running, and pushing data from the /ramdisk files to the Prometheus database.
Grafana Dashboard
We can now add a first dashboard to Grafana itself. Since we have only the above MUST inverter as a sample, let’s use that for now. We start by adding a new dashboard: got to the Grafana URL (http://192.168.0.11:3000/, remember to use your IP address), log in (user: admin, password: admin unless you changed it) and add a new data source in configuration:
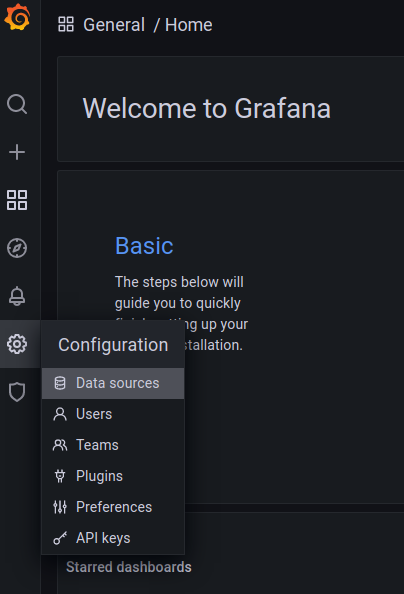
Select a Prometheus data source (should be near the top) and create it. The default settings should all be fine, just enter http://localhost:9090 in the “URL” field (the default is just a placeholder):
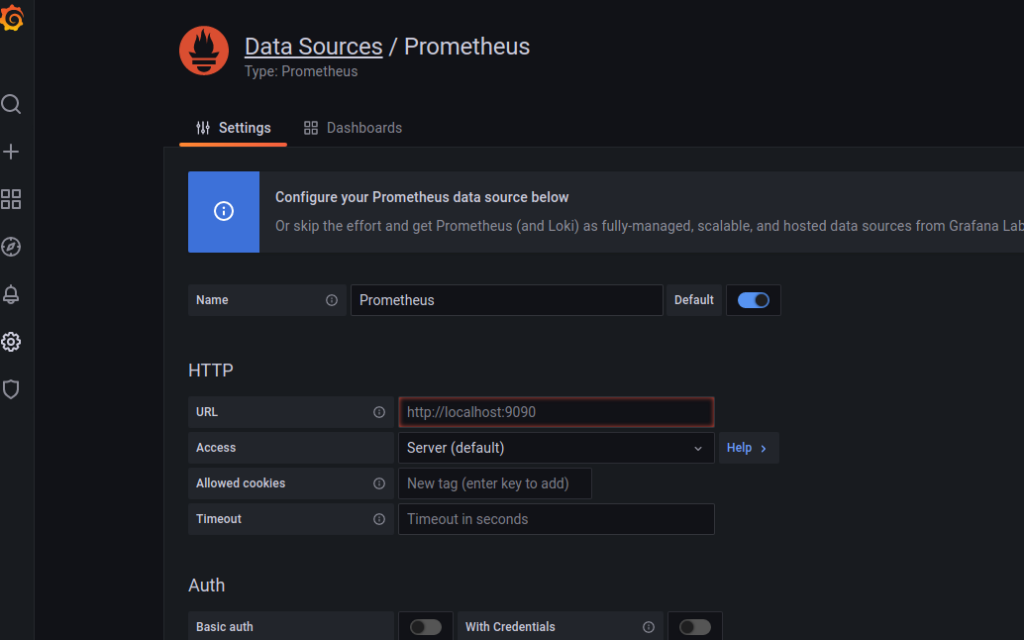
Click “Save and Test” at the bottom, and it should respond with “Data source is working”. Next, let’s add a dashboard:
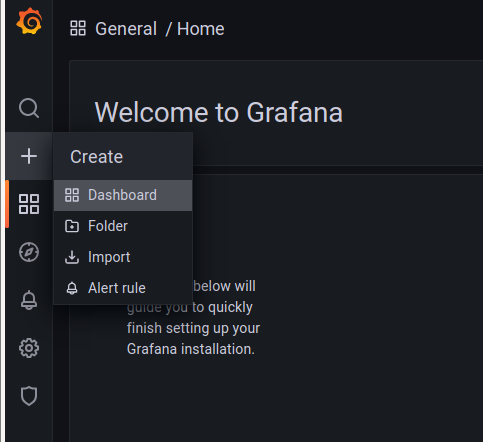
Add a new panel to the dashboard:
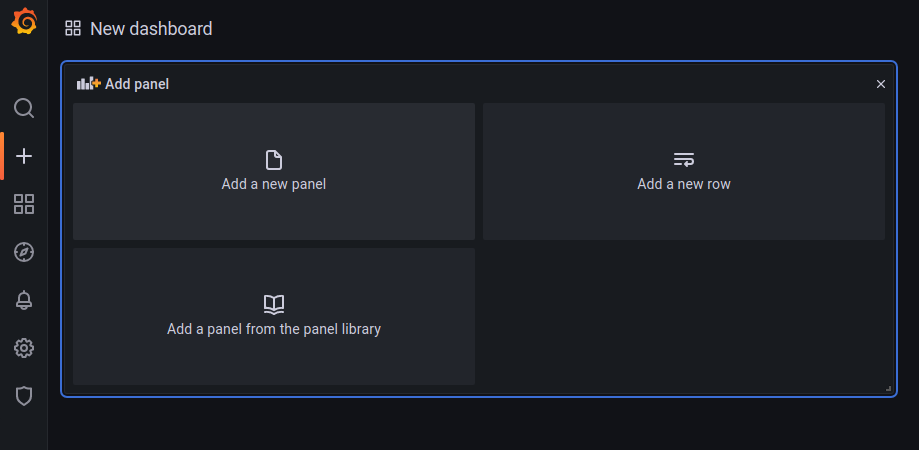
You should now see something like this:
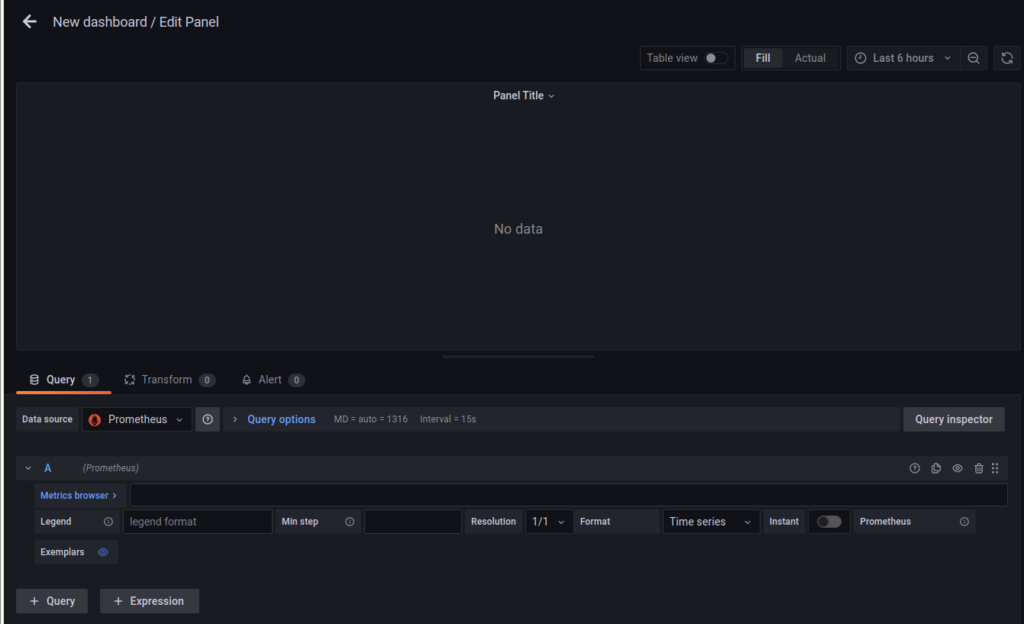
If you enter the following in the “Metrics Browser”, you should be able to see your first graph:
MUST_INV{mode="batVolts"}
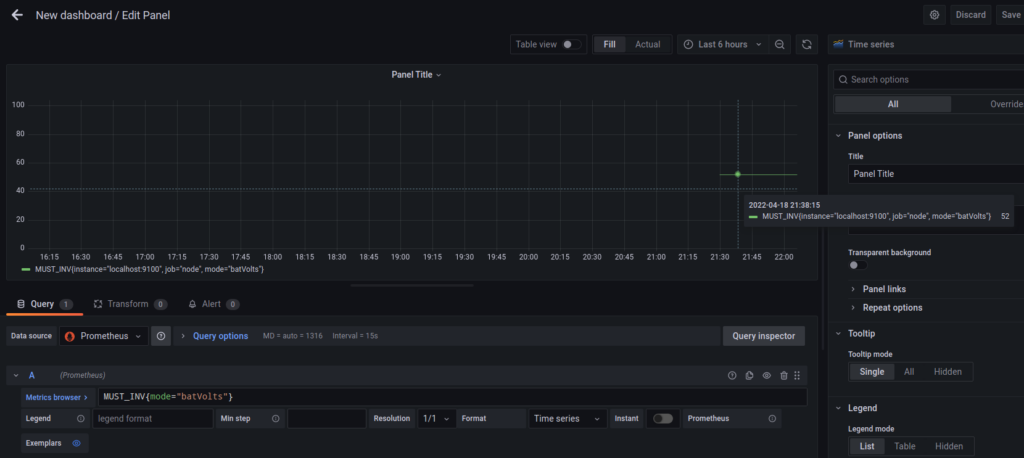
Congratulations, you’re up and running! Of course, you don’t have to build all these panels from scratch. You can find several demo’s for example here, which you can directly import:
https://github.com/PurpleAlien/jk-bms_grafana
https://github.com/BarkinSpider/SolarShed
Serial Comms
Most devices communicate through some form of serial communication, be it TTL, RS232, RS485 with or without ModBus, etc. Individual scripts will be responsible to talk to the device itself and format the data, but we need to put the infrastructure in place to do so. The easiest way and most widely used method to do this for all those different devices is likely the Python programming language, so we have to make sure we have everything set to run those Python scripts.
Run the following commands to get the core needed packages:
sudo apt install -y python3-pipsudo pip3 install pyserialsudo pip3 install minimalmodbus
That should get you all set to start communicating with your solar equipment, and graphing data! I’ve shared the code to talk to my devices in their respective sections on this site. You can find them all on my GitHub page: https://github.com/PurpleAlien – look for the xyz_grafana repos.
